A little while ago I wrote about adding on-premises servers or virtual servers to your tenant using Azure Arc, and in the article touched a little on Defender for Cloud and using it to protect workloads on Azure. Where Defender for Cloud is mainly a cloud-native application protection platform (CNAPP), Microsoft Sentinel is a cloud-native Security Information and Event Management (SIEM) solution that provides intelligent security analytics and threat intelligence across enterprise networks, cloud environments, and identities. It allows you to collect security data from different sources, analyze it in real-time, and automate security responses. These aren’t two competing products, in fact they’re more complementary to each other.
In this article, then, I will be more or less picking up from where I left after having my server(s) added to Azure Arc, and enabling Microsoft Sentinel on the subscription, setting up the workspace for it and connecting the Linux servers’ syslog logs to Sentinel in order to collect important security information.
Enabling Azure Monitor
This isn’t strictly speaking necessary to do at this step, as you could let the agent install automatically upon Data Collection Rule (DCR) creation, however I feel that making sure that everything is in order before proceeding is good practice. But you do you.
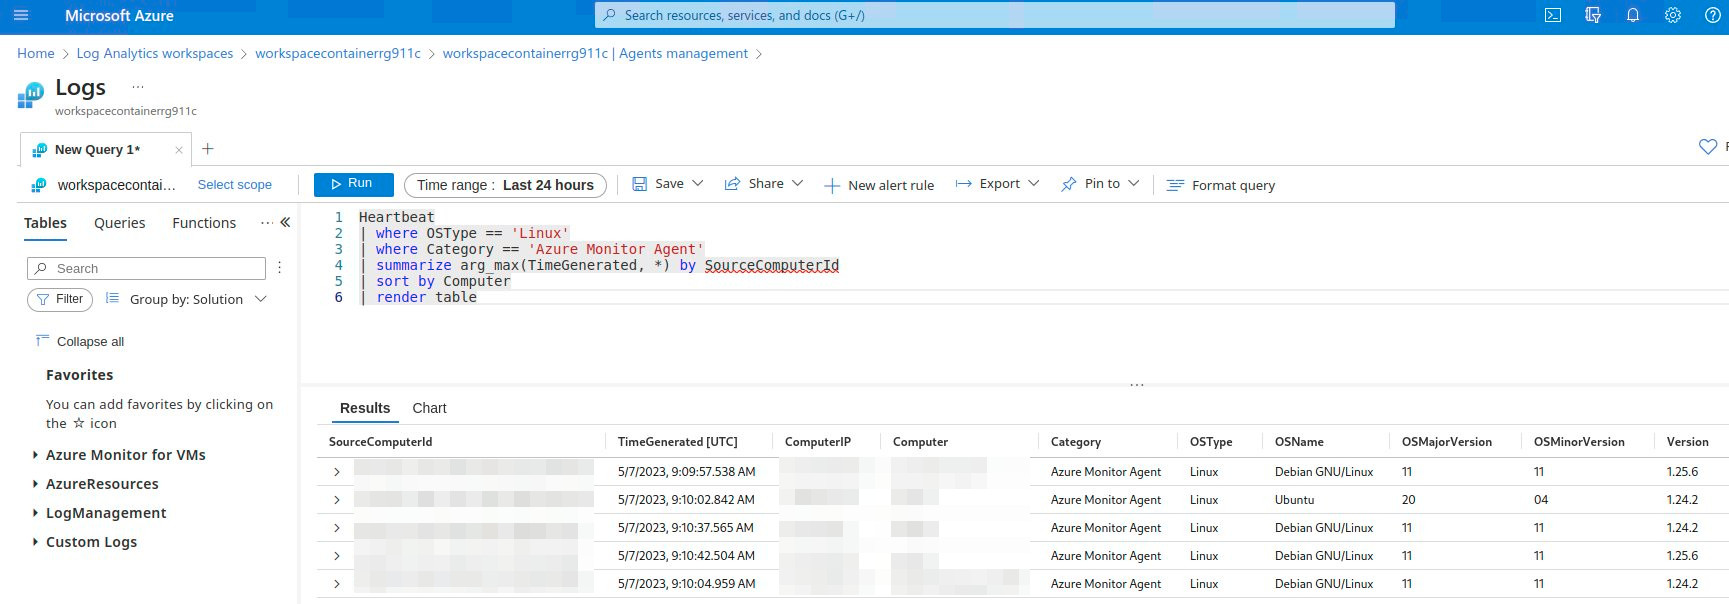
This can be done by installing the agent either via enforced policy, or by navigating to Azure Arc > Servers > Server name > Settings, Extensions > Add and selecting Azure Monitor Agent for Linux. If you choose to install the agent at this point you can also verify that it’s installed correctly and submits data by querying for Heartbeat with the following:
1
2
3
4
5
6
Heartbeat
| where OSType == 'Linux'
| where Category == 'Azure Monitor Agent'
| summarize arg_max(TimeGenerated, *) by SourceComputerId
| sort by Computer
| render table
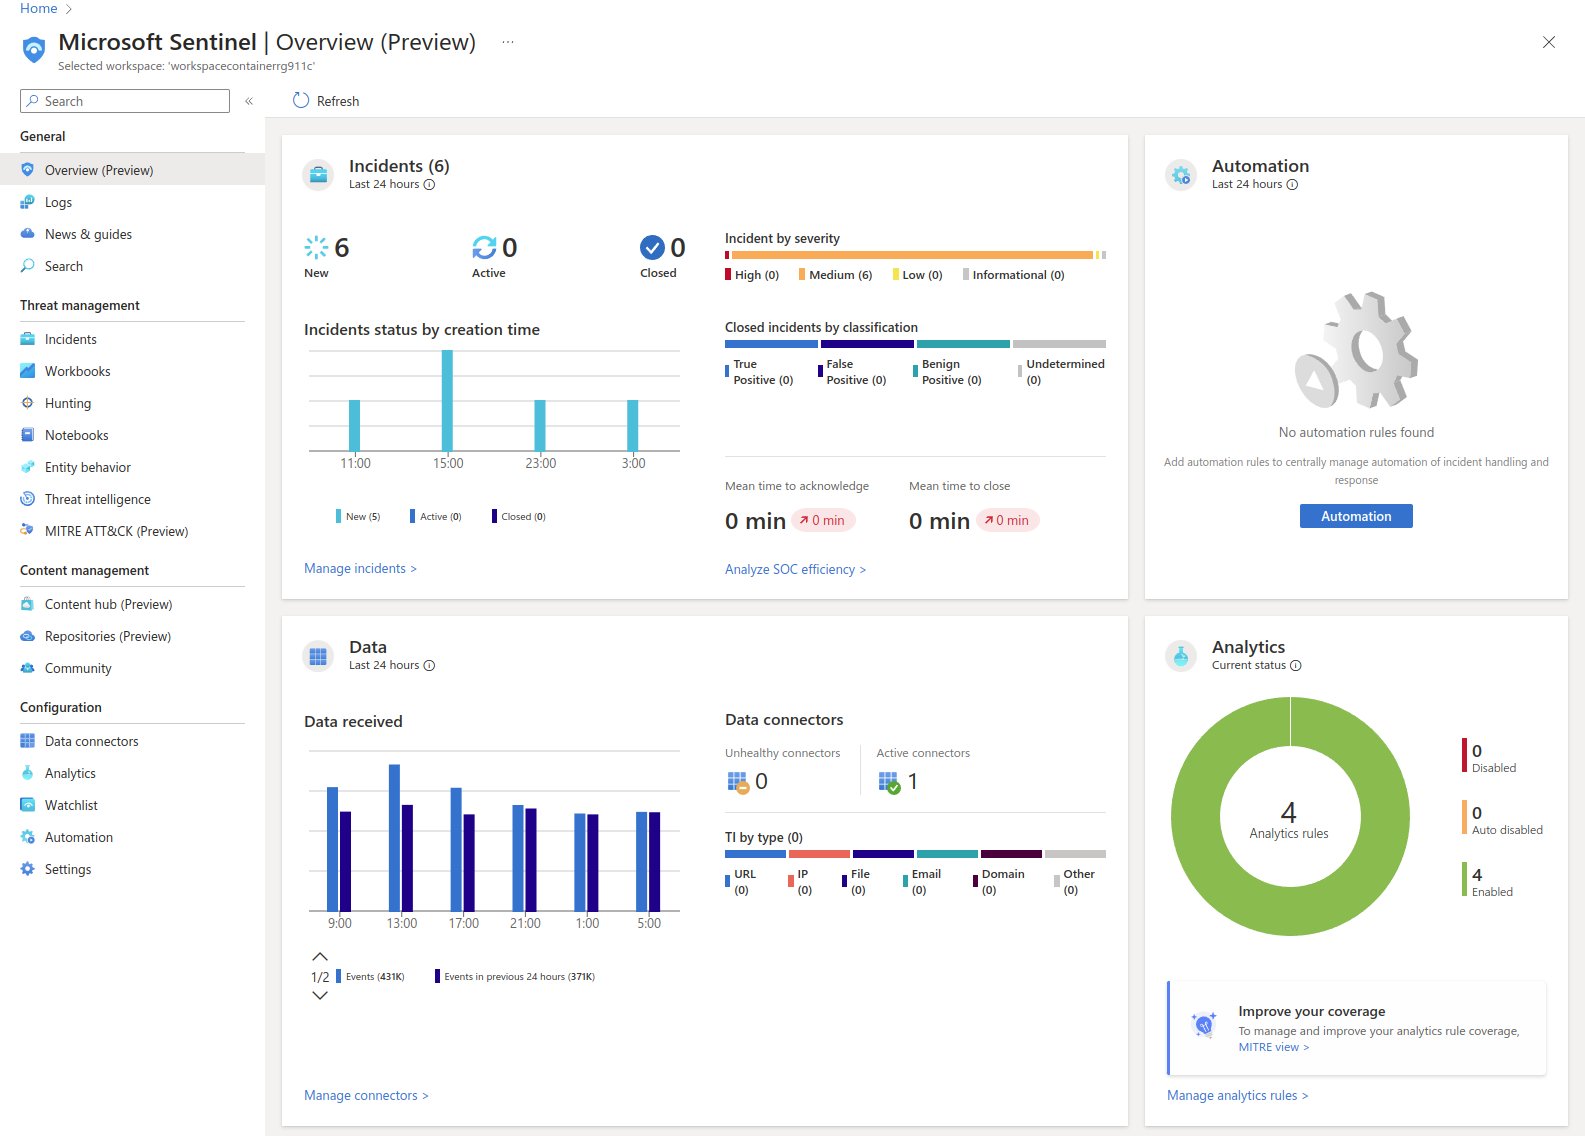
Enabling Microsoft Sentinel
Next step is enabling Sentinel on the subscription. Sentinel requires a Log Analytics workspace for all the log files to be stored, and it would be best practice to create a new one for all the security/Sentinel related activities, as well as having multiple workspaces if you’re working in a multi-tenant environment. Pros and cons to different kinds of approaches, and there’s actually a good Microsoft webinar about this very subject you may want to watch if you’re wodndering about the best practices of workspace and tenant architecture.
Once the Log Analytics workspace is created, adding Sentinel to ingest data from it is very straightforward. Here it’s good to note that while Sentinel in and of itself incurs not actual costs, the costs related to it come from the need to manage all the log files and they’re broken down to two: those in Sentinel and those in Log Analytics workspace. As with most things in cloud, the costs can ramp up quickly, so make sure that you’re not storing an unnecessary amount of logs especially if you’re just testing things out.
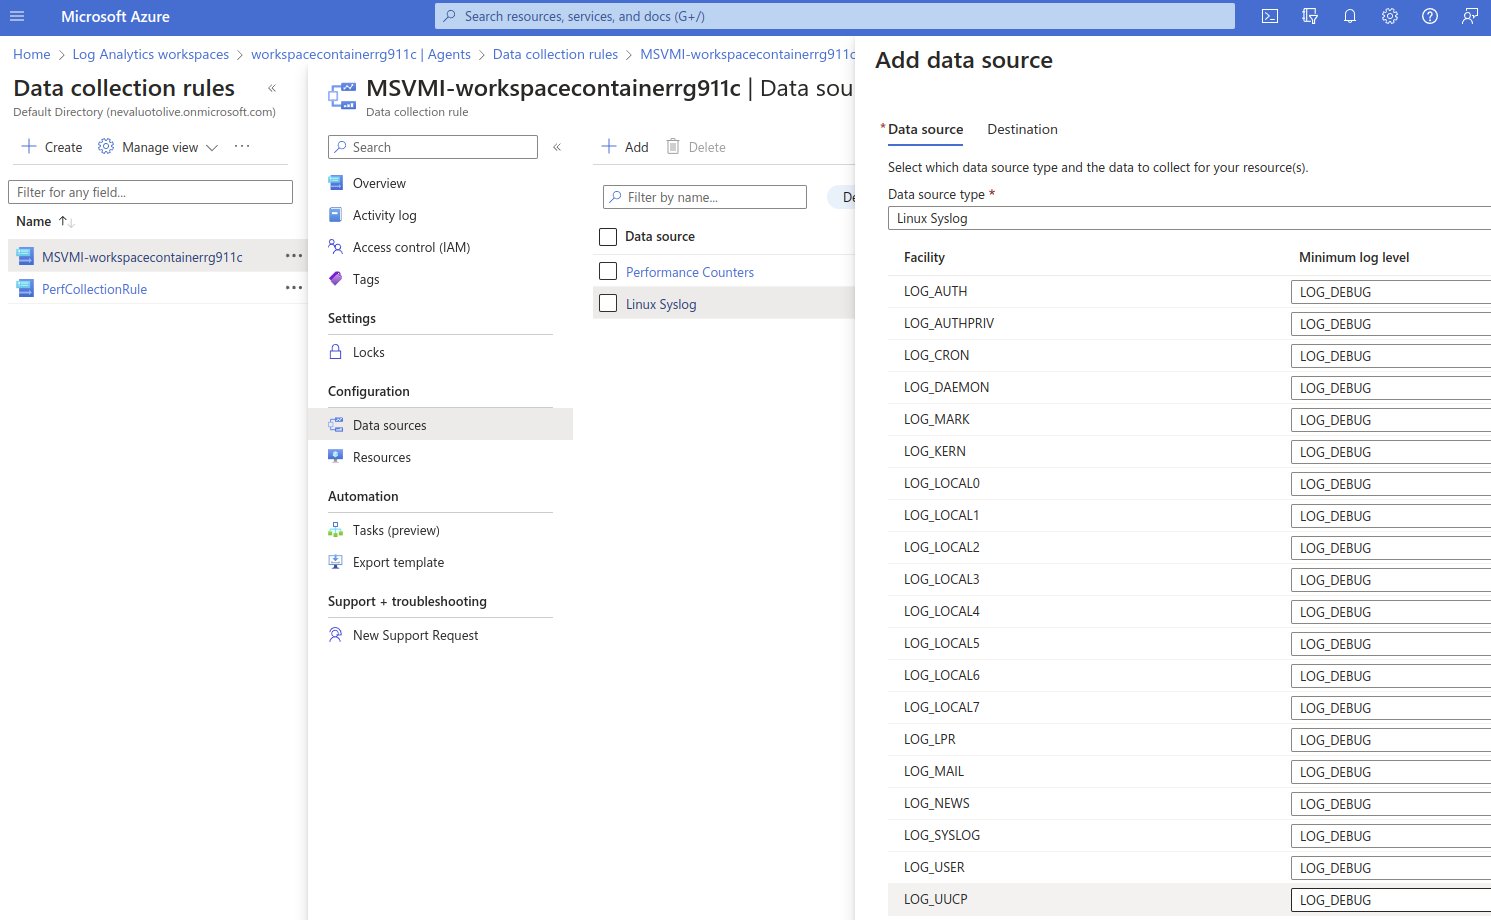
Configuring Data Collection Rules
In order to start collecting our Syslog files we need a Data Collection Rule.
- Log in to the Azure portal and navigate to Data Collection Rules
- Create a new rule, and select whether you want to collect data from Windows, Linux or both
- Add the resources / resource groups you want to collect the data from
- Add a data source, in this case Linux Syslog. Feel free to adjust the Minimum log levels to your liking, or just leave them default
- Add destination, and select Destination type as Azure Monitor Logs, Subscription to whatever subscription you want and workspace as the workspace created before
- Click on Review + Create
Once the DCR is created it can be viewed and edited on the same page. We can also confirm that everything is running smoothly by running e.g., the following KQL query:
1
2
Syslog
| top 100 by TimeGenerated desc
This will fetch the last 100 Syslog entries that were sent, so we can see if they are in fact coming in.
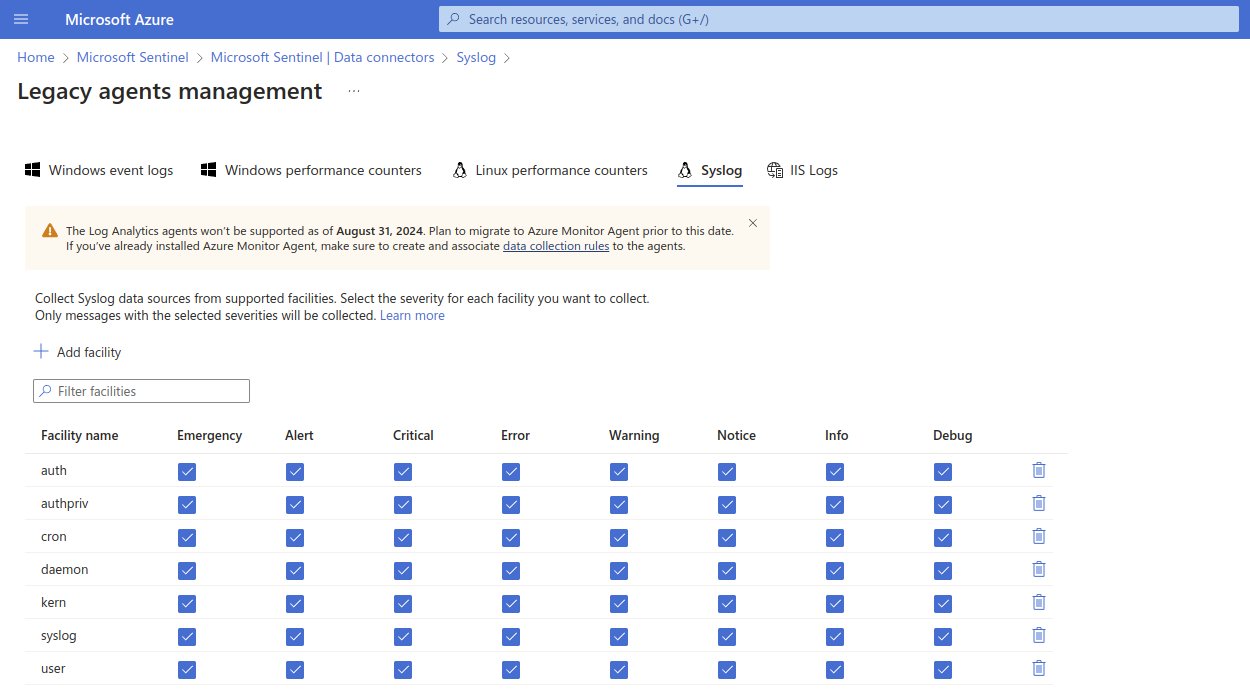
Configuring Data Connectors
This is a bit of a legacy step in a way, but I’m still including it for the sake of clarity. You see, Microsoft used to have (and technically still does at the time of writing) an agent called Log Analytics agent, which needed some extra configuration for the Syslog connector. The agent is on a deprecation path and won’t be supported after August 31, 2024, and considering that the Monitor Agent is configured with the Data Collection Rules this step is unnecessary now. You can still see some information about the data ingested from Sys log via the connector, but as the logs are sent directly to the workspace Sentinel manages, there is no extra step here.
Configuring Analytics Rules
Having all this data flowing in is nice and all, but unless we’re interested in manually digging through it via KQL queries we’re going to need something a bit more automatic. Enter Analytics Rules. Many of these come preinstalled and activated once the Syslog connector activates, but you can always create your own or use community created ones in order to really dig into the types of alerts that are the most important in your environment.
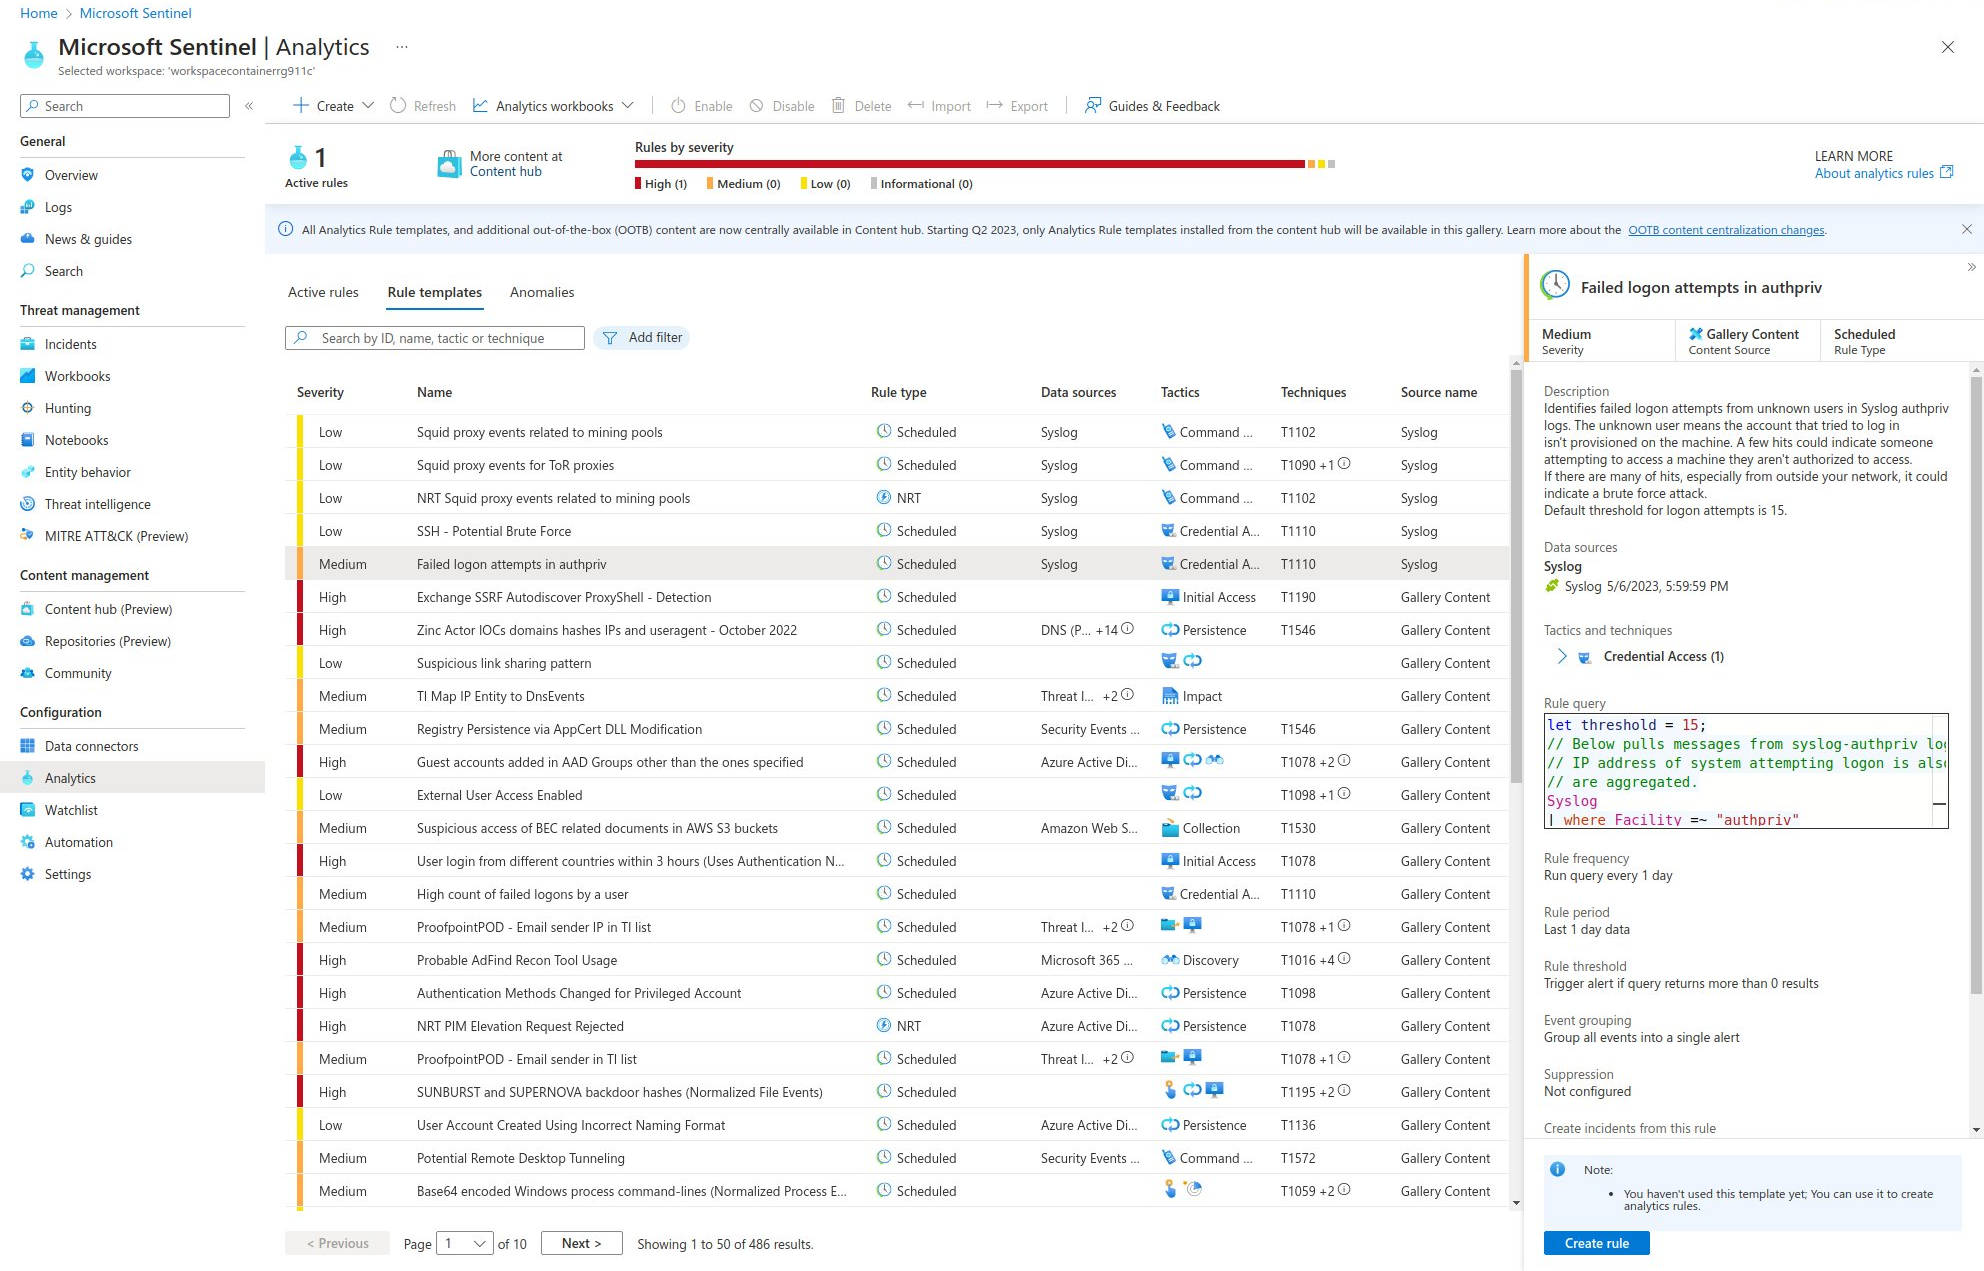
Here we’re simply creating a rule from a template, so we’ll select Rule templates, look up a Syslog-based rule called Failed logon attempts in authpriv and click Create rule. In the Analytics rule wizard we really only need to set the Status to Enabled, but this is where you could also edit the rule logic, incident settings and even create automated response that could automate some actions when the rule gets triggered, like for example assign owner, tags to the incident, or even run a playbook that could be used to automate threat response.
Investigating an Incident with Microsoft Sentinel
It probably goes without saying that there’s a lot more to incident investigation than what’s shown here now, but refer to the screenshot below to see an example of an alert triggered in Sentinel based on a Syslog entry that matches an Analytics Rule that was set before. The rule matched here is Failed logon attempts in authpriv, and it uses the following rule (which by default has a threshold of 15, but I changed to just 1 to trigger the alert):
1
2
3
4
5
6
7
8
9
10
11
12
13
14
15
16
17
18
19
20
21
22
23
24
25
26
27
28
29
30
31
32
let threshold = 15;

// Below pulls messages from syslog-authpriv logs where there was an authentication failure with an unknown user.
// IP address of system attempting logon is also extracted from the SyslogMessage field. Some of these messages
// are aggregated.

Syslog
| where Facility =~ "authpriv"
| where SyslogMessage has "authentication failure" and SyslogMessage has " uid=0"
| parse SyslogMessage with * "rhost=" RemoteIP
| project TimeGenerated, Computer, ProcessName, HostIP, RemoteIP, ProcessID
| join kind=innerunique (

// Below pulls messages from syslog-authpriv logs that show each instance an unknown user tried to logon.

Syslog
| where Facility =~ "authpriv"
| where SyslogMessage has "user unknown"
| project Computer, HostIP, ProcessID
) on Computer, HostIP, ProcessID

// Count the number of failed logon attempts by External IP and internal machine

| summarize FirstLogonAttempt = min(TimeGenerated), LatestLogonAttempt = max(TimeGenerated), TotalLogonAttempts = count() by Computer, HostIP, RemoteIP

// Calculate the time between first and last logon attempt (AttemptPeriodLength)

| extend TimeBetweenLogonAttempts = LatestLogonAttempt - FirstLogonAttempt
| where TotalLogonAttempts >= threshold
| project FirstLogonAttempt, LatestLogonAttempt, TimeBetweenLogonAttempts, TotalLogonAttempts, SourceAddress = RemoteIP, DestinationHost = Computer, DestinationAddress = HostIP
| sort by DestinationHost asc nulls last
| extend timestamp = FirstLogonAttempt, HostCustomEntity = DestinationHost, IPCustomEntity = DestinationAddress
Digging deeper into the alert we can find all kinds of interesting information that may or may not refer to this incident, like for example information on new or deleted users on host, new or deleted users over time, sign-in activity, sudo usage on host, sudo usage over time and more.
Conclusion
Microsoft Sentinel is an important security solution for on-premises, hybrid and multi-cloud environments as it enables organizations to collect, analyze and respond to security threats in a unified and efficient manner with it’s single pane of glass view of the security posture of the environment. In addition to static detection rules like the one covered in this example, Microsoft Sentinel’s advanced analytics capabilities, such as machine learning and behavior analytics, can identify abnormal activity and detect previously unknown threats that might go unnoticed by traditional security solutions.
For me this exercise helped to further understand the flow of information from the source (in this case, a failed logon attempt on the on-premises host) to Syslog, then to Azure workspace and finally to Sentinel which used the information to create an actionable alert for the SOC personnel to handle.