If you’ve ever used any kind of Internet of Things (IoT) device or platform, you’ll know that the data generated by sensors and devices holds immense value, and collecting that data is arguably the main reason these devices exist in the first place. While having HomeAssistant record how many times you’ve opened your bedroom door isn’t necessarily all that useful information, it still shows the process and probably gives an idea as to why something like this might be done. A better example would be collecting temperature information from your IoT temperature sensors, which you could use either in real-time to adjust heating or cooling or over a longer period of time to gather averages and do whatever people do with that information. Which takes us to…
This week’s AZ-305 lab, which I chose to revolve around IoT and Azure Stream Analytics since that’s something I’m not too familiar with, but it’s an integral part of the Azure infrastructure offering. As usual at this point, this isn’t some deep dive into the technology but rather a quick setup with some musings on the usefulness of the solution.
What is Azure Stream Analytics
Let’s start with the basics. According to Wikipedia, Azure Stream Analytics, or ASA, is “a serverless scalable complex event processing engine by Microsoft that enables users to develop and run real-time analytics on multiple streams of data from sources such as devices, sensors, web sites, social media, and other applications”. That’s to say that it takes data from a source, analyzes it via queries, and then, at least preferably, sends that data somewhere for further use.
In this lab example, we’ll have 2000 or so entries of data from temperature “sensors,” including both temperature and humidity data, and we’ll be using ASA to aggregate this information into a more manageable and useful format that could then, for example, be sent forward to trigger Azure Functions or just stored in a database.
Creating a Stream Analytics Job
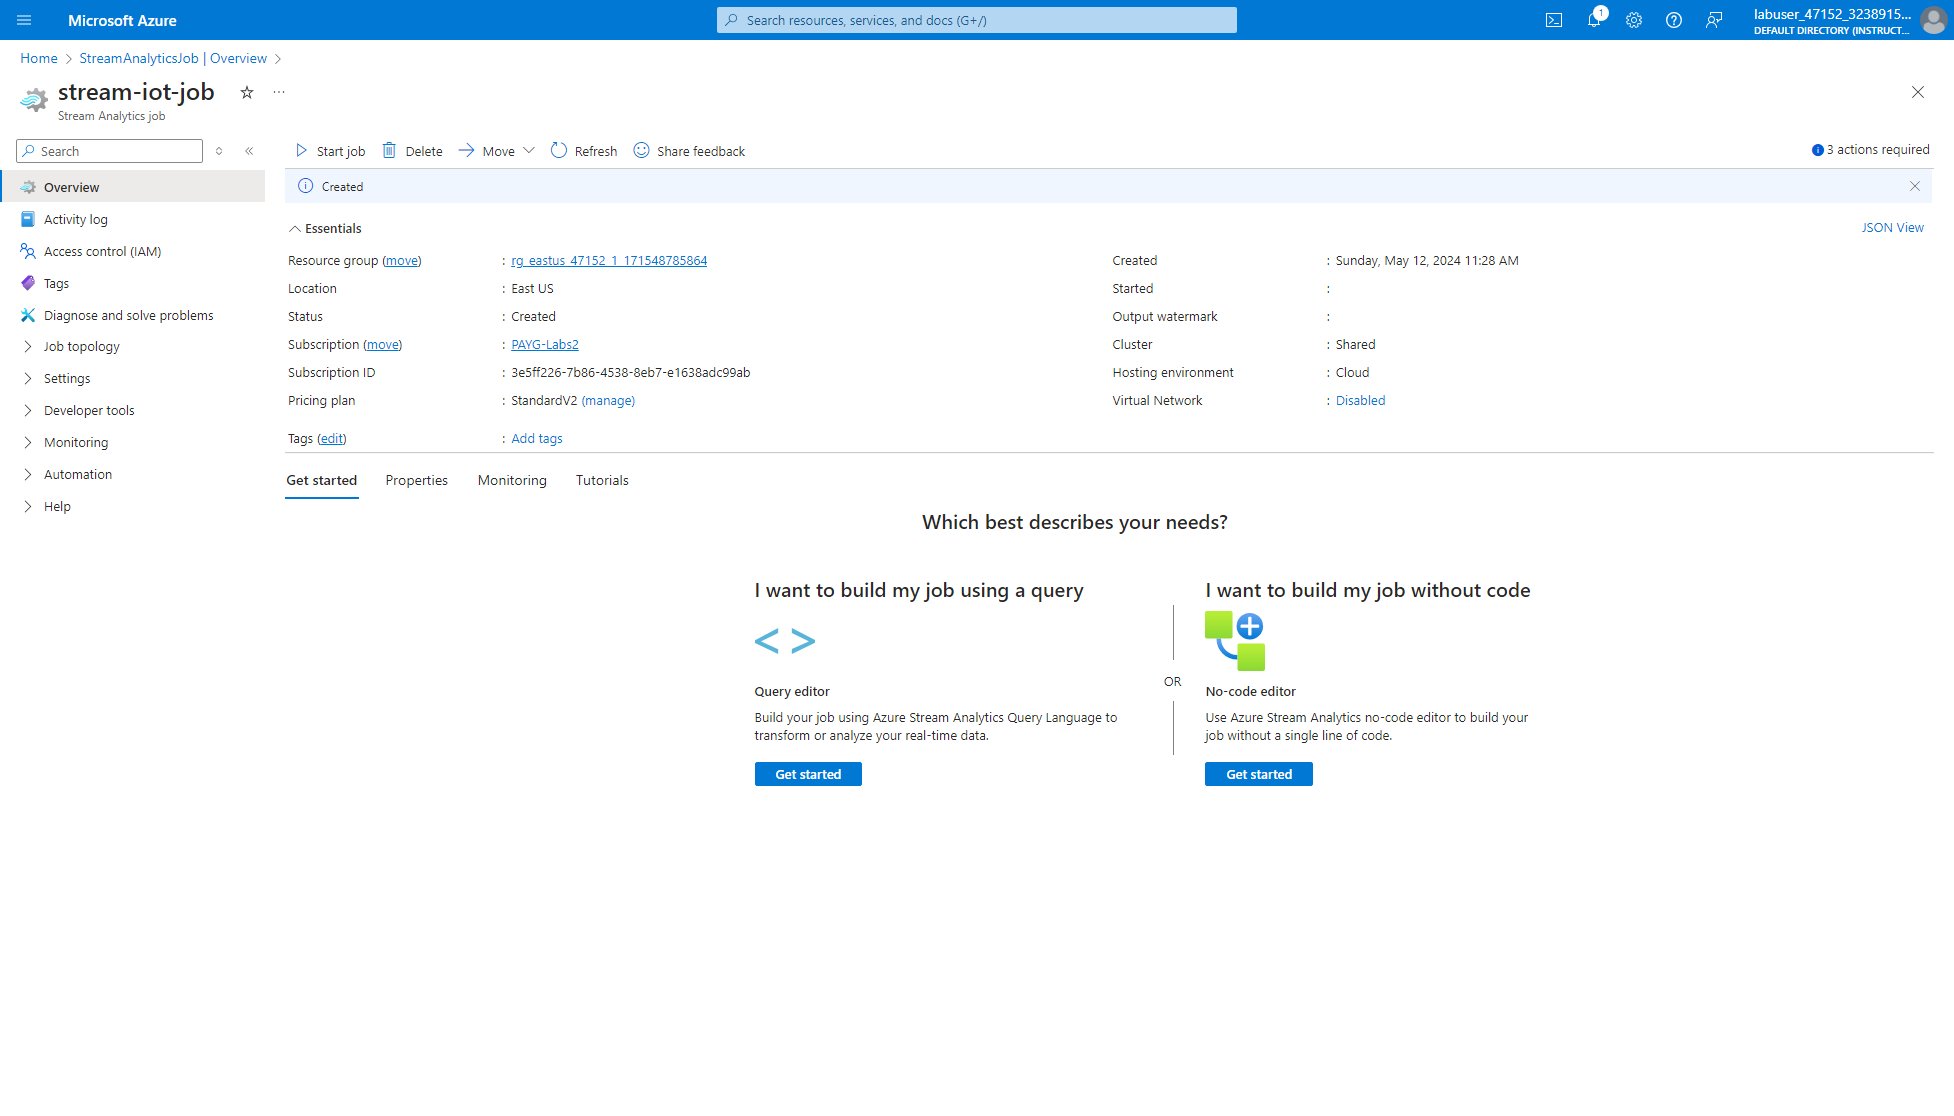
First, we’re going to need a Stream Analytics Job, which is the functionality that lets us specify and verify our inputs, outputs, and queries. Essentially, this is the part that does something with the supplied data.
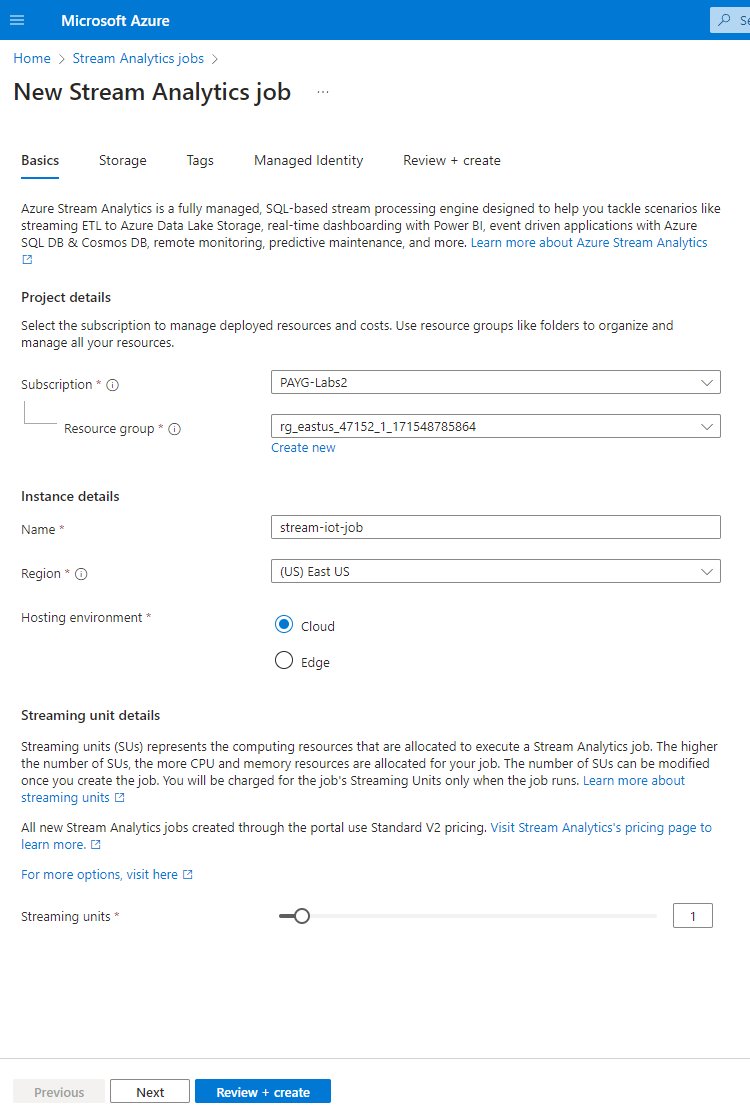
Creating one is as easy as you’d expect, and we really just need to make sure our Resource group, Region, Hosting environment and resource names are correct. Note that we also need to select the amount of Streaming units, or SUs. These are essentially the amount of CPU and memory resources allocated to the analytics job, with a larger amount making things faster, as expected. At the time of writing, in Central US, the PAYG price of the first 0-730 SU hours is $0.406, and it drops quite a lot after that. For the lab, we’ll just leave it at one.
You should refer to https://azure.microsoft.com/en-us/pricing/details/stream-analytics/ for more information on pricing.
Configuring Stream Analytics for IoT data
Once the deployment is complete, we can move on to configuring our analytics query by creating a new Stream Analytics Job. While in this case we’ll just be importing some test data in a .json file, let’s first take a quick look at other possibilities for both data sources and destinations, or input and outputs as they’re called.
Stream input:
- Blob storage/ADLS Gen2
- Event Hub
- IoT Hub
- Kafka (preview)
Reference input: - Blob storage/ADLS Gen2
- SQL Database
Output:
- Azure Data Explorer
- Azure Function
- Azure Synapse Analytics
- Blob storage/ADLS Gen2
- Cosmos DB
- Data Lake Storage Gen1
- Event Hub
- Kafka (preview)
- PostgreSQL
- Power BI
- Service Bus queue
- Service Bus topic
- SQL Database
- Table storage
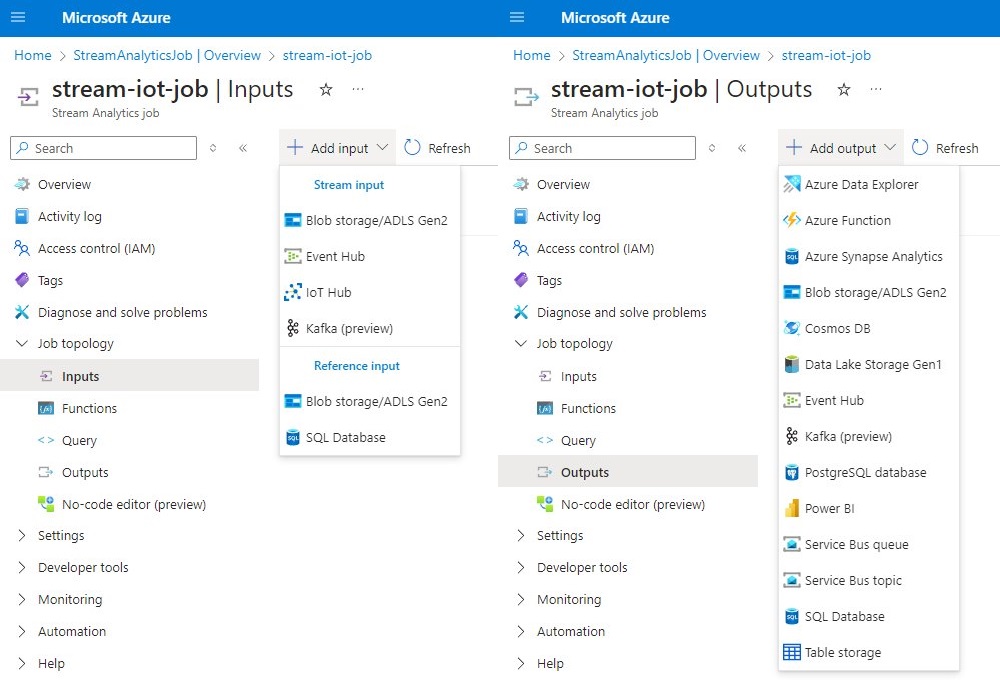
As you can see, there are lots of options for both inputs and outputs, and all the data ingested can and will be queried using the Stream Analytics job. And speaking of which, here’s a snippet of the test data we’ll be working with:
1
2
3
4
5
6
7
8
9
10
11
12
{
    "time": "2016-01-26T20:47:53.0000000",
    "dspl": "sensorE",
    "temp": 123,
    "hmdt": 34
},
{
    "time": "2016-01-26T20:47:54.0000000",
    "dspl": "sensorC",
    "temp": 77,
    "hmdt": 49
},
As you can see, it’s very simple and just includes the timestamp, the sensor name, temperature, and humidity information. But this is the kind of information you might be working with, so it’ll do just fine for this exercise.
Uploading the sample data and writing the query
Opening the main Stream Analytics Jobs resource and selecting Properties gives us access to the inputs, outputs, functions, and queries. WhizLabs provided us with a .json file, which we can just upload as the data, which will then be shown in the Input preview in table format.
Next, we need to add our SQL-like query, which will be as follows:
1
2
3
4
5
6
SELECT system.timestamp AS endtime,
    dspl AS sensorname,
    Count(*) AS numreadings INTO output
FROM inputstream TIMESTAMP by time
GROUP BY tumblingwindow(minute, 5),
    dspl
A quick rundown of the query, courtesy of Copilot, which does a better job than what I ever could at explaining it:
SELECT system.timestamp AS endtime: Renames the timestamp column from the input stream as “endtime”.dspl AS sensorname: This renames the “dspl” column as “sensorname”.Count(*) AS numreadings: Calculates the count of records (readings) and assigns it to the alias “numreadings”.FROM inputstream TIMESTAMP by time: Specifies the input stream named “inputstream” and indicates that the timestamp for each record is provided by the “time” field.GROUP BY tumblingwindow(minute, 5), dspl: Groups the data into time windows of 5 minutes each (tumbling window) based on the timestamp. Within each window, it further groups the data by the “dspl” field (sensor name).INTO output: Specifies the output stream where the results will be written. The output stream is named “output”.
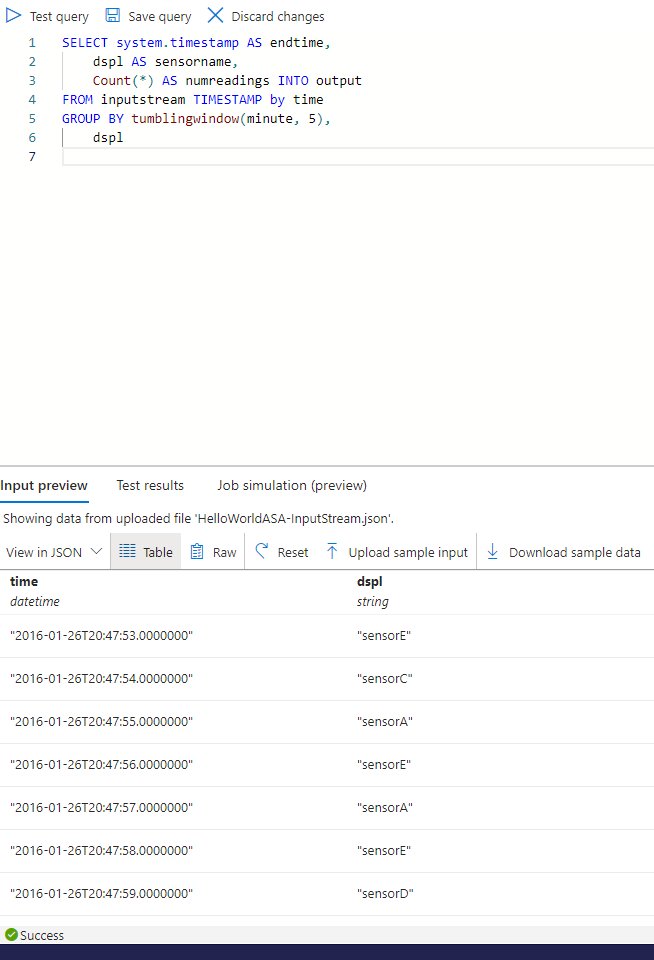
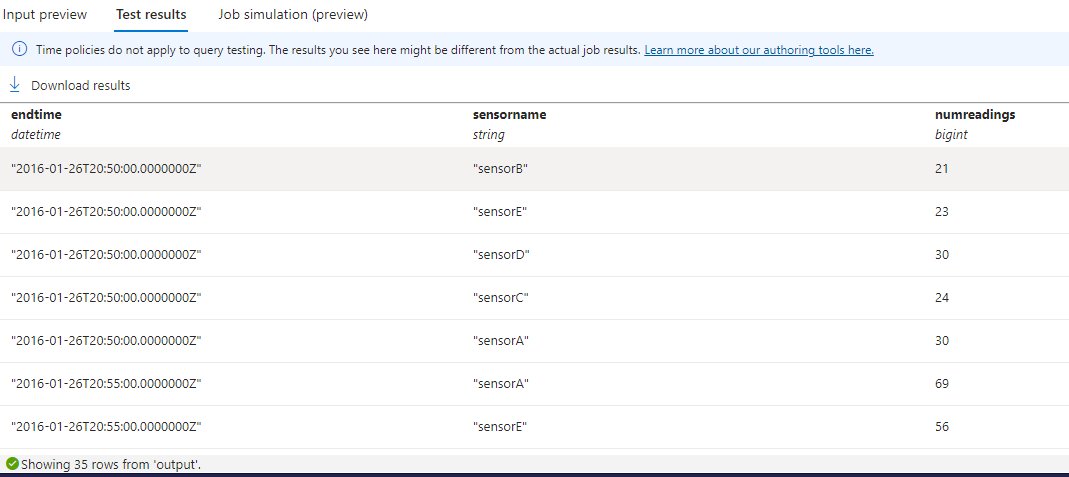
Once everything is in order, we just need to click on Test query, and after a little while, the Test results window will show us an aggregated view from each sensor in 5-minute intervals, listing how many sensor readings our data had during that time period.
And that’s really it; that’s how we took a .json file with 2000 data entries and condensed them down to more easily manageable data for analysis. From this point on, like previously discussed, we could take this output and trigger an Azure Function, do something with Power BI, just store the result, or just about anything else we might want or need.
Conclusion
Personally, I don’t think I’ll ever be working with anything IoT-related on Azure (knock, knock); however, this is exactly the kind of snippet of knowledge that’s sure to come in handy sooner or later, and while this wasn’t a very complex lab, venturing a little outside the guided portion allowed me to consider the opportunities offered by the multitude of data inputs and outputs supported by Stream Analytics.